Publishing test traces to Grafana using otel4s and weaver
Let's explore how we can publish test traces to Grafana Cloud using otel4s and weaver while running tests on GitHub Action.
Even though CI machines often differ from production environments, and recorded spans might be volatile, we can still collect enough evidence to analyze system components' performance (latency).
So why bother with test traces? There are a few benefits:
- Identify potential bottlenecks
- Track performance degradation
- Check the structure of spans
The complete example is available in the GitHub repository.
While this example uses Grafana Cloud, it will work with any OTLP-compatible setup: Jaeger, Honeycomb, etc.
1. Why use weaver and otel4s?
Weaver is an excellent choice for testing due to its seamless integration with Cats Effect, parallelism out of the box, and flexible API.
otel4s is an OpenTelemetry implementation for Scala built on top of Cats Effect. The library is available for all platforms: JVM, Scala.js, Scala Native.
2. otel4s befriends weaver
Settings up the project
To set up your project include the following dependencies in your build.sbt file:
libraryDependencies ++= Seq(
  "org.typelevel"       %% "otel4s-core-trace"         % "0.8.1",
  "org.typelevel"       %% "otel4s-sdk-exporter-trace" % "0.8.1" % Test,
  "com.disneystreaming" %% "weaver-cats"               % "0.8.4" % Test,
  "com.disneystreaming" %% "weaver-scalacheck"         % "0.8.4" % Test
)
How weaver handles test results
Weaver handles test results slightly differently from traditional testing frameworks by leveraging the Expectations as the outcome of a test.
Instead of failing tests with exceptions, tests return a value of type Expectations, where Expectations is defined as ValidatedNel[AssertionException, Unit].
Extending weaver
First of all, we need to instrument the tests with the traces. Let's start with the utility object:
object TraceUtils {

  def trace[F[_]: MonadCancelThrow: Tracer](
      suiteName: String,
      name: TestName
  )(fa: F[Expectations]): F[Expectations] = {
    val testName = name.name

    def attributes = Attributes( // <1>
      Attribute("test.name", testName),
      Attribute("test.suite", suiteName),
      Attribute("test.source", name.location.fileRelativePath + ":" + name.location.line),
      Attribute("test.tags", name.tags.toSeq)
    )

    Tracer[F]
      .spanBuilder(s"$suiteName - $testName")
      .addAttributes(attributes)
      .withFinalizationStrategy(SpanFinalizer.Strategy.empty) // <2>
      .build
      .use(span => fa.guaranteeCase(recordOutcome(span)))
  }

  def recordOutcome[F[_]: Monad](span: Span[F]): Outcome[F, Throwable, Expectations] => F[Unit] =
    ???
}- Configure span attributes: the test name, suite name, source location, and any tags associated with the test.
- Disable default finalization strategy: we'll handle the statuses manually by recording the outcome of the test execution.
To ensure proper span finalization based on test results, we need to implement the recordOutcome function:
private val AnsiColorRegex = "\u001b\\[([;\\d]*)m".r

def recordOutcome[F[_]: Monad](span: Span[F]): Outcome[F, Throwable, Expectations] => F[Unit] = {
  case Outcome.Succeeded(fa) =>
    fa.flatMap { expectations =>
      expectations.run.fold( // <1>
        e => span.setStatus(StatusCode.Error) >> span.recordException(removeAnsiColors(e.head)),
        _ => span.setStatus(StatusCode.Ok)
      )
    }

  case Outcome.Canceled() =>
    span.setStatus(StatusCode.Error, "canceled") // <2>

  case Outcome.Errored(error) => // <3>
    span.setStatus(StatusCode.Error) >> span.recordException(removeAnsiColors(error))
}

private def removeAnsiColors(throwable: Throwable): Throwable =
  throwable match {
    case a: AssertionException =>
      a.copy(message = AnsiColorRegex.replaceAllIn(a.message, ""))

    case other =>
      other
}- If there's an error, we set the span status to
Errorand record the exception. If the expectations are met, we set the span status toOk. - Set the span status to
Errorwith the description 'canceled', indicating that the test was aborted. - Set the span status to
Errorand record the exception.
Additionally, the removeAnsiColors function cleans up ANSI escape codes from the exception messages to ensure they appear clearly in Grafana or Jaeger.
Extending the SimpleIOSuite and IOSuite
Weaver provides two types of test suites:
SimpleIOSuitefor tests without shared resourcesIOSuitefor tests with shared resources
We can add a tracedTest utility method to the TracedSimpleIOSuite trait:
trait TracedSimpleIOSuite extends SimpleIOSuite {

  def tracedTest(name: TestName)(run: Tracer[IO] => IO[Expectations]): Unit =
    registerTest(name)(_ => Test(name.name, traced(name)(run)))

  private def traced(testName: TestName)(body: Tracer[IO] => IO[Expectations]): IO[Expectations] =
    SdkTraces
      .autoConfigured[IO](_.addExporterConfigurer(OtlpSpanExporterAutoConfigure[IO])) // <1>
      .evalMap(_.tracerProvider.get(getClass.getName.stripSuffix("$")))
      .use(implicit tracer => TraceUtils.trace(name, testName)(body(tracer))) // <2>
}- Create an auto-configured
Tracer[IO]. - Use
TraceUtils.traceto wrap the test execution in a tracing span and record the outcome.
For tests that use shared resources, such as a Tracer[IO], the TracedIOSuite provides a way to integrate tracing into IOSuite:
trait TracedIOSuite extends IOSuite { self =>
  type Res = Tracer[IO]

  def sharedResource: Resource[IO, Tracer[IO]] = // <1>
    SdkTraces
      .autoConfigured[IO](_.addExporterConfigurer(OtlpSpanExporterAutoConfigure[IO]))
      .evalMap(_.tracerProvider.get(getClass.getName.stripSuffix("$")))

  override def test(name: TestName): PartiallyAppliedTest = // <2>
    new TracedPartiallyAppliedTest(name)

  private final class TracedPartiallyAppliedTest(
      testName: TestName
  ) extends PartiallyAppliedTest(testName) {
    override def apply(run: Res => IO[Expectations]): Unit =
      registerTest(testName) { tracer =>
        Test(testName.name, (log: Log[IO]) => traced(log, tracer)((res, _) => run(res)))
      }

    override def apply(run: (Res, Log[IO]) => IO[Expectations]): Unit =
      registerTest(testName) { tracer =>
        Test(testName.name, (log: Log[IO]) => traced(log, tracer)(run))
      }

    private def traced(
        log: Log[IO],
        tracer: Tracer[IO]
    )(run: (Tracer[IO], Log[IO]) => IO[Expectations]): IO[Expectations] =
      TraceUtils.trace(name, testName)(run(tracer, log))(implicitly, tracer)
  }
}- The
sharedResourcemethod sets up a sharedTracer[IO]instance that is created once per suite, so all tests within the suite use the sameTracer. - The
testmethod is overridden to incorporate tracing into the test execution.
Bonus point. Instrumenting ScalaCheck
ScalaCheck is a powerful property-based testing framework that allows you to test your code against pseudo-randomly generated properties.
We can wrap each property check invocation into its own span to make traces more meaningful and granular:
trait TracedIOCheckers extends Checkers { self: MutableIOSuite =>
  // must be 'def', so for every instantiation there will be a fresh counter
  implicit protected def unwrapWithTrace(implicit T: Tracer[F]): PropF[F[Expectations]] =
    new Checkers.Prop[F, F[Expectations]] {
      private val counter = Ref.unsafe[IO, Int](0)
      def lift(a: F[Expectations]): F[Expectations] =
        for {
          count <- counter.getAndUpdate(_ + 1)
          result <- Tracer[F]
            .spanBuilder(s"forall#$count")
            .withFinalizationStrategy(SpanFinalizer.Strategy.empty)
            .build
            .use(span => a.guaranteeCase(TraceUtils.recordOutcome(span)))
        } yield result
    }
}
The unwrapWithTrace method creates a new tracing span for each property check invocation. The span name includes a counter to differentiate between multiple property checks within the same test.
3. Write tests
With the tracing utilities in place, we can finally write tests for the Service class that calculates the sum of two numbers:
class Service[F[_]: Temporal: Tracer: Random] {
  def sum(x: Long, y: Long): F[Long] =
    Tracer[F].span("sum", Attribute("x", x), Attribute("y", y)).surround {
      for {
        delay <- Random[F].nextIntBounded(50)
        _     <- Temporal[F].sleep(delay.millis) // simulates computation time
      } yield x + y
    }
}

object Service {
  def create[F[_]: Async: Tracer]: F[Service[F]] =
    Random.scalaUtilRandom[F].map(implicit random => new Service[F])
}
Tests with TracedSimpleIOSuite
object ServiceSuite extends TracedSimpleIOSuite with TracedIOCheckers {
  tracedTest("calculate a sum of numbers (fixed)") { implicit tracer =>
    for {
      service <- Service.create[IO]
      result  <- service.sum(1L, 2L)
    } yield expect(result == 3L)
  }

  tracedTest("calculate a sum of numbers") { implicit tracer =>
    forall { (a: Long, b: Long) =>
      for {
        service <- Service.create[IO]
        result  <- service.sum(a, b)
      } yield expect(result == (a + b))
    }
  }
}
Tests with TracedIOSuite
object ServiceSharedTracerSuite extends TracedIOSuite with TracedIOCheckers {
  test("calculate a sum of numbers (fixed)") { implicit tracer =>
    for {
      service <- Service.create[IO]
      result  <- service.sum(1L, 2L)
    } yield expect(result == 3L)
  }

  test("calculate a sum of numbers") { implicit tracer =>
    forall { (a: Long, b: Long) =>
      for {
        service <- Service.create[IO]
        result  <- service.sum(a, b)
      } yield expect(result == (a + b))
    }
  }
}
4. Collect traces
Now, our tests are instrumented and can export proper traces. It's time to collect them while running tests on GitHub Actions.
Prepare build.sbt
I suggest using sbt-github-actions plugin to generate the GitHub Actions workflow. First of all, we need to bind OpenTelemetry variables to configure the exporter:
ThisBuild / githubWorkflowEnv ++= Map(
  "OTEL_EXPORTER_OTLP_PROTOCOL" -> "${{ secrets.OTEL_EXPORTER_OTLP_PROTOCOL }}", // <1>
  "OTEL_EXPORTER_OTLP_ENDPOINT" -> "${{ secrets.OTEL_EXPORTER_OTLP_ENDPOINT }}", // <2>
  "OTEL_EXPORTER_OTLP_HEADERS"  -> "${{ secrets.OTEL_EXPORTER_OTLP_HEADERS }}",  // <3>
  "OTEL_SERVICE_NAME"           -> "${{ github.ref }}",                          // <4>
  "OTEL_RESOURCE_ATTRIBUTES"    -> "revision=${{ github.sha }}",                 // <5>
  "OTEL_SDK_DISABLED"           -> "${{ !startsWith(github.ref, 'refs/pull') }}" // <6>
)- Define the protocol for exporting traces (e.g., grpc, http/protobuf)
- The OTLP collector endpoint where spans should be sent
- Security headers for authentication with the collector
- Dynamically name the service based on the GitHub reference
- Include additional attributes (like commit SHA) for filtering traces in Grafana
- Disable tracing for non-PR branches, ensuring traces are only published for pull requests
Configure Cloud Grafana
There are a few mandatory steps before we can start sending traces to the Grafana:
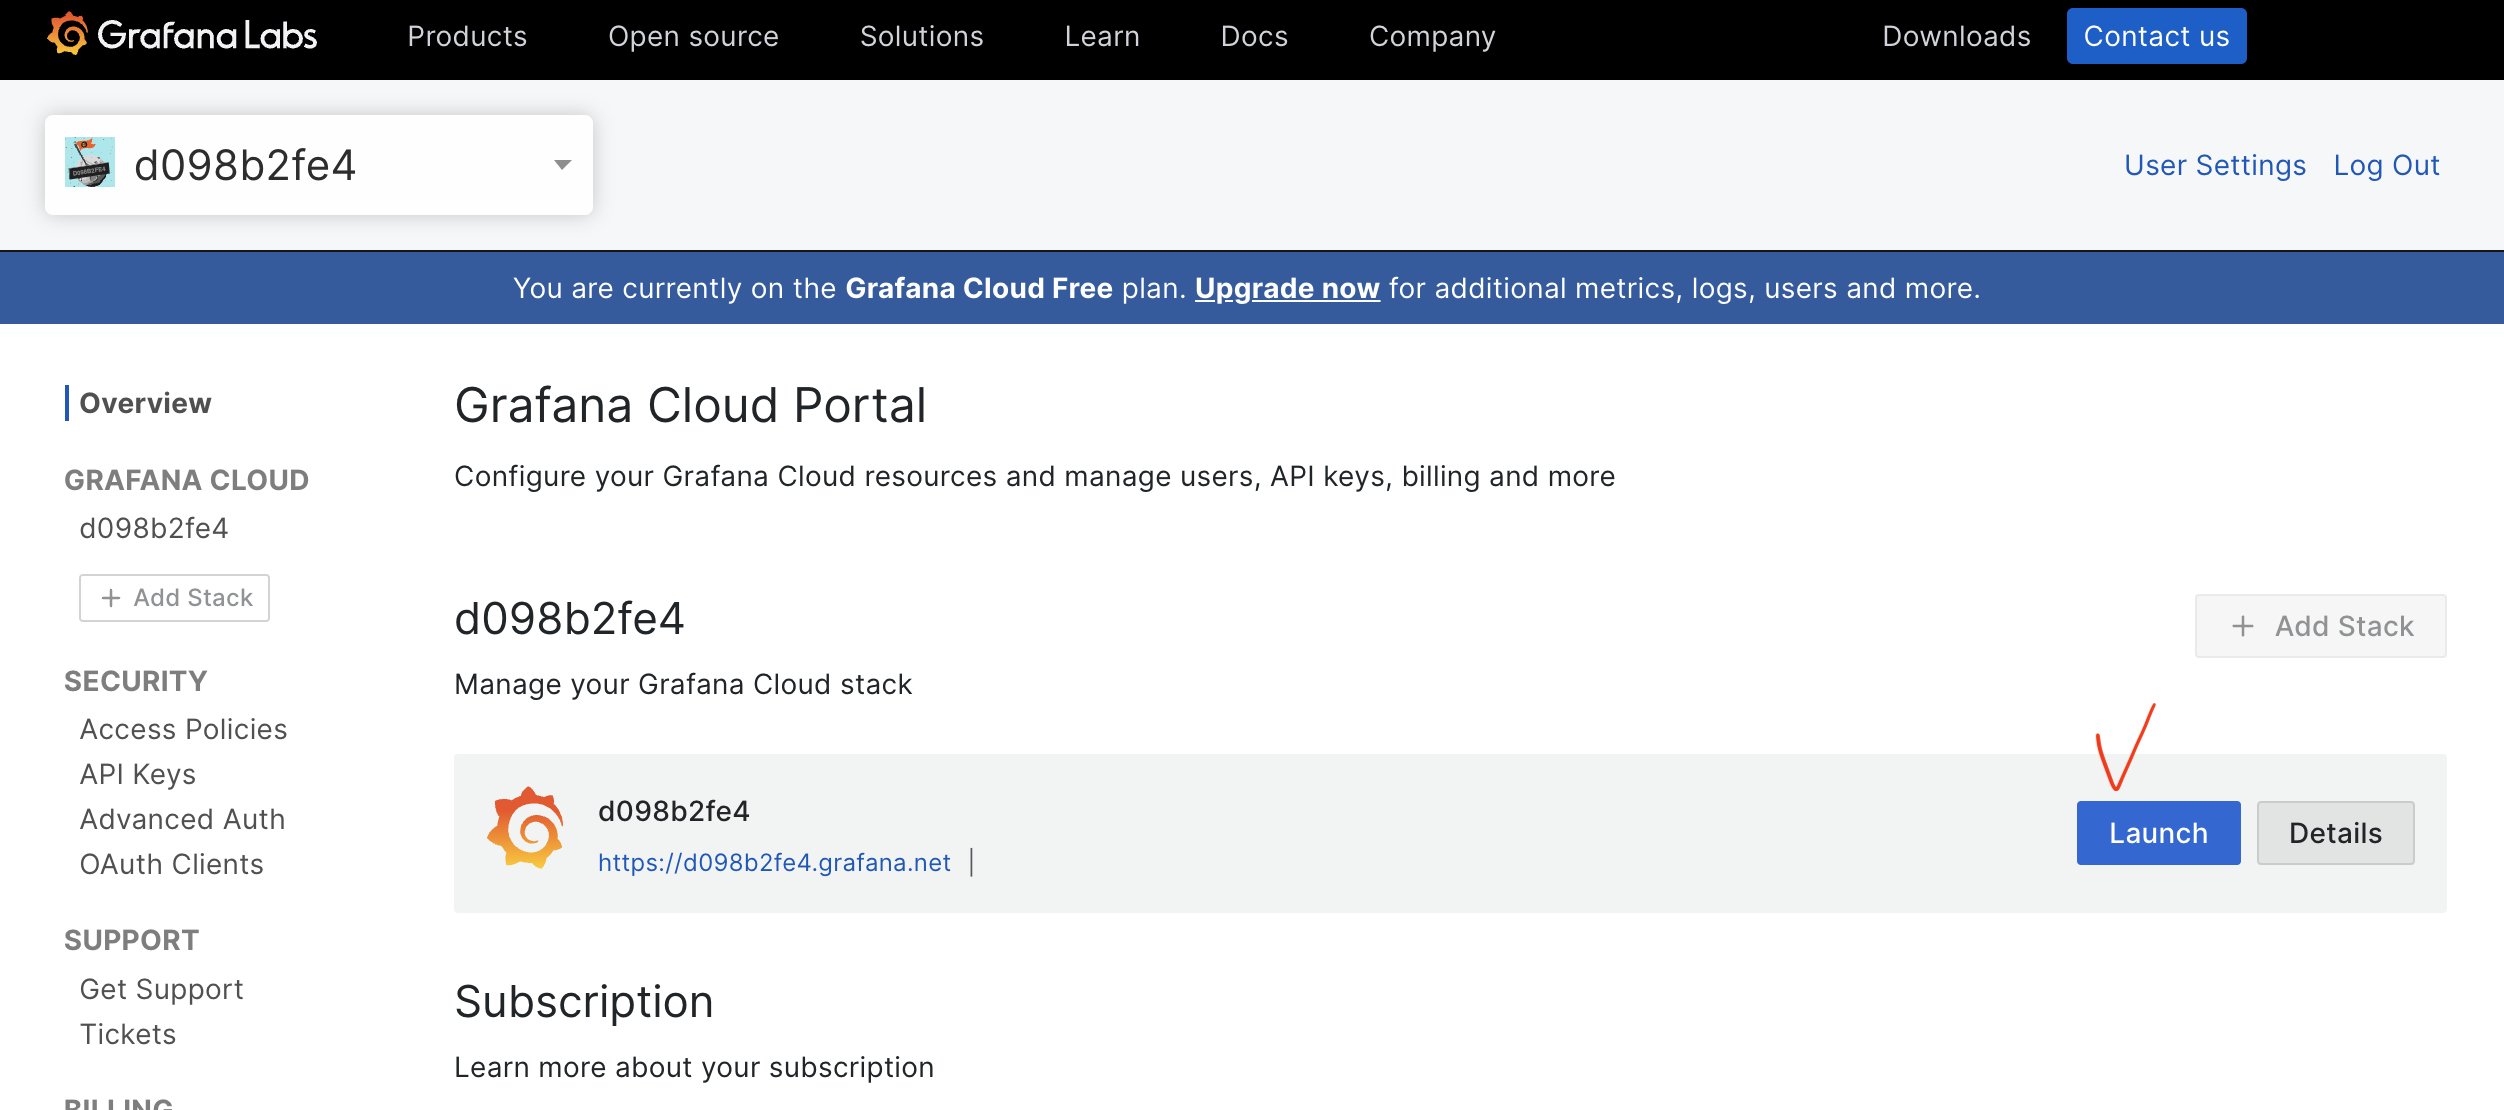
Sign-in into Grafana Cloud and navigate to your org:
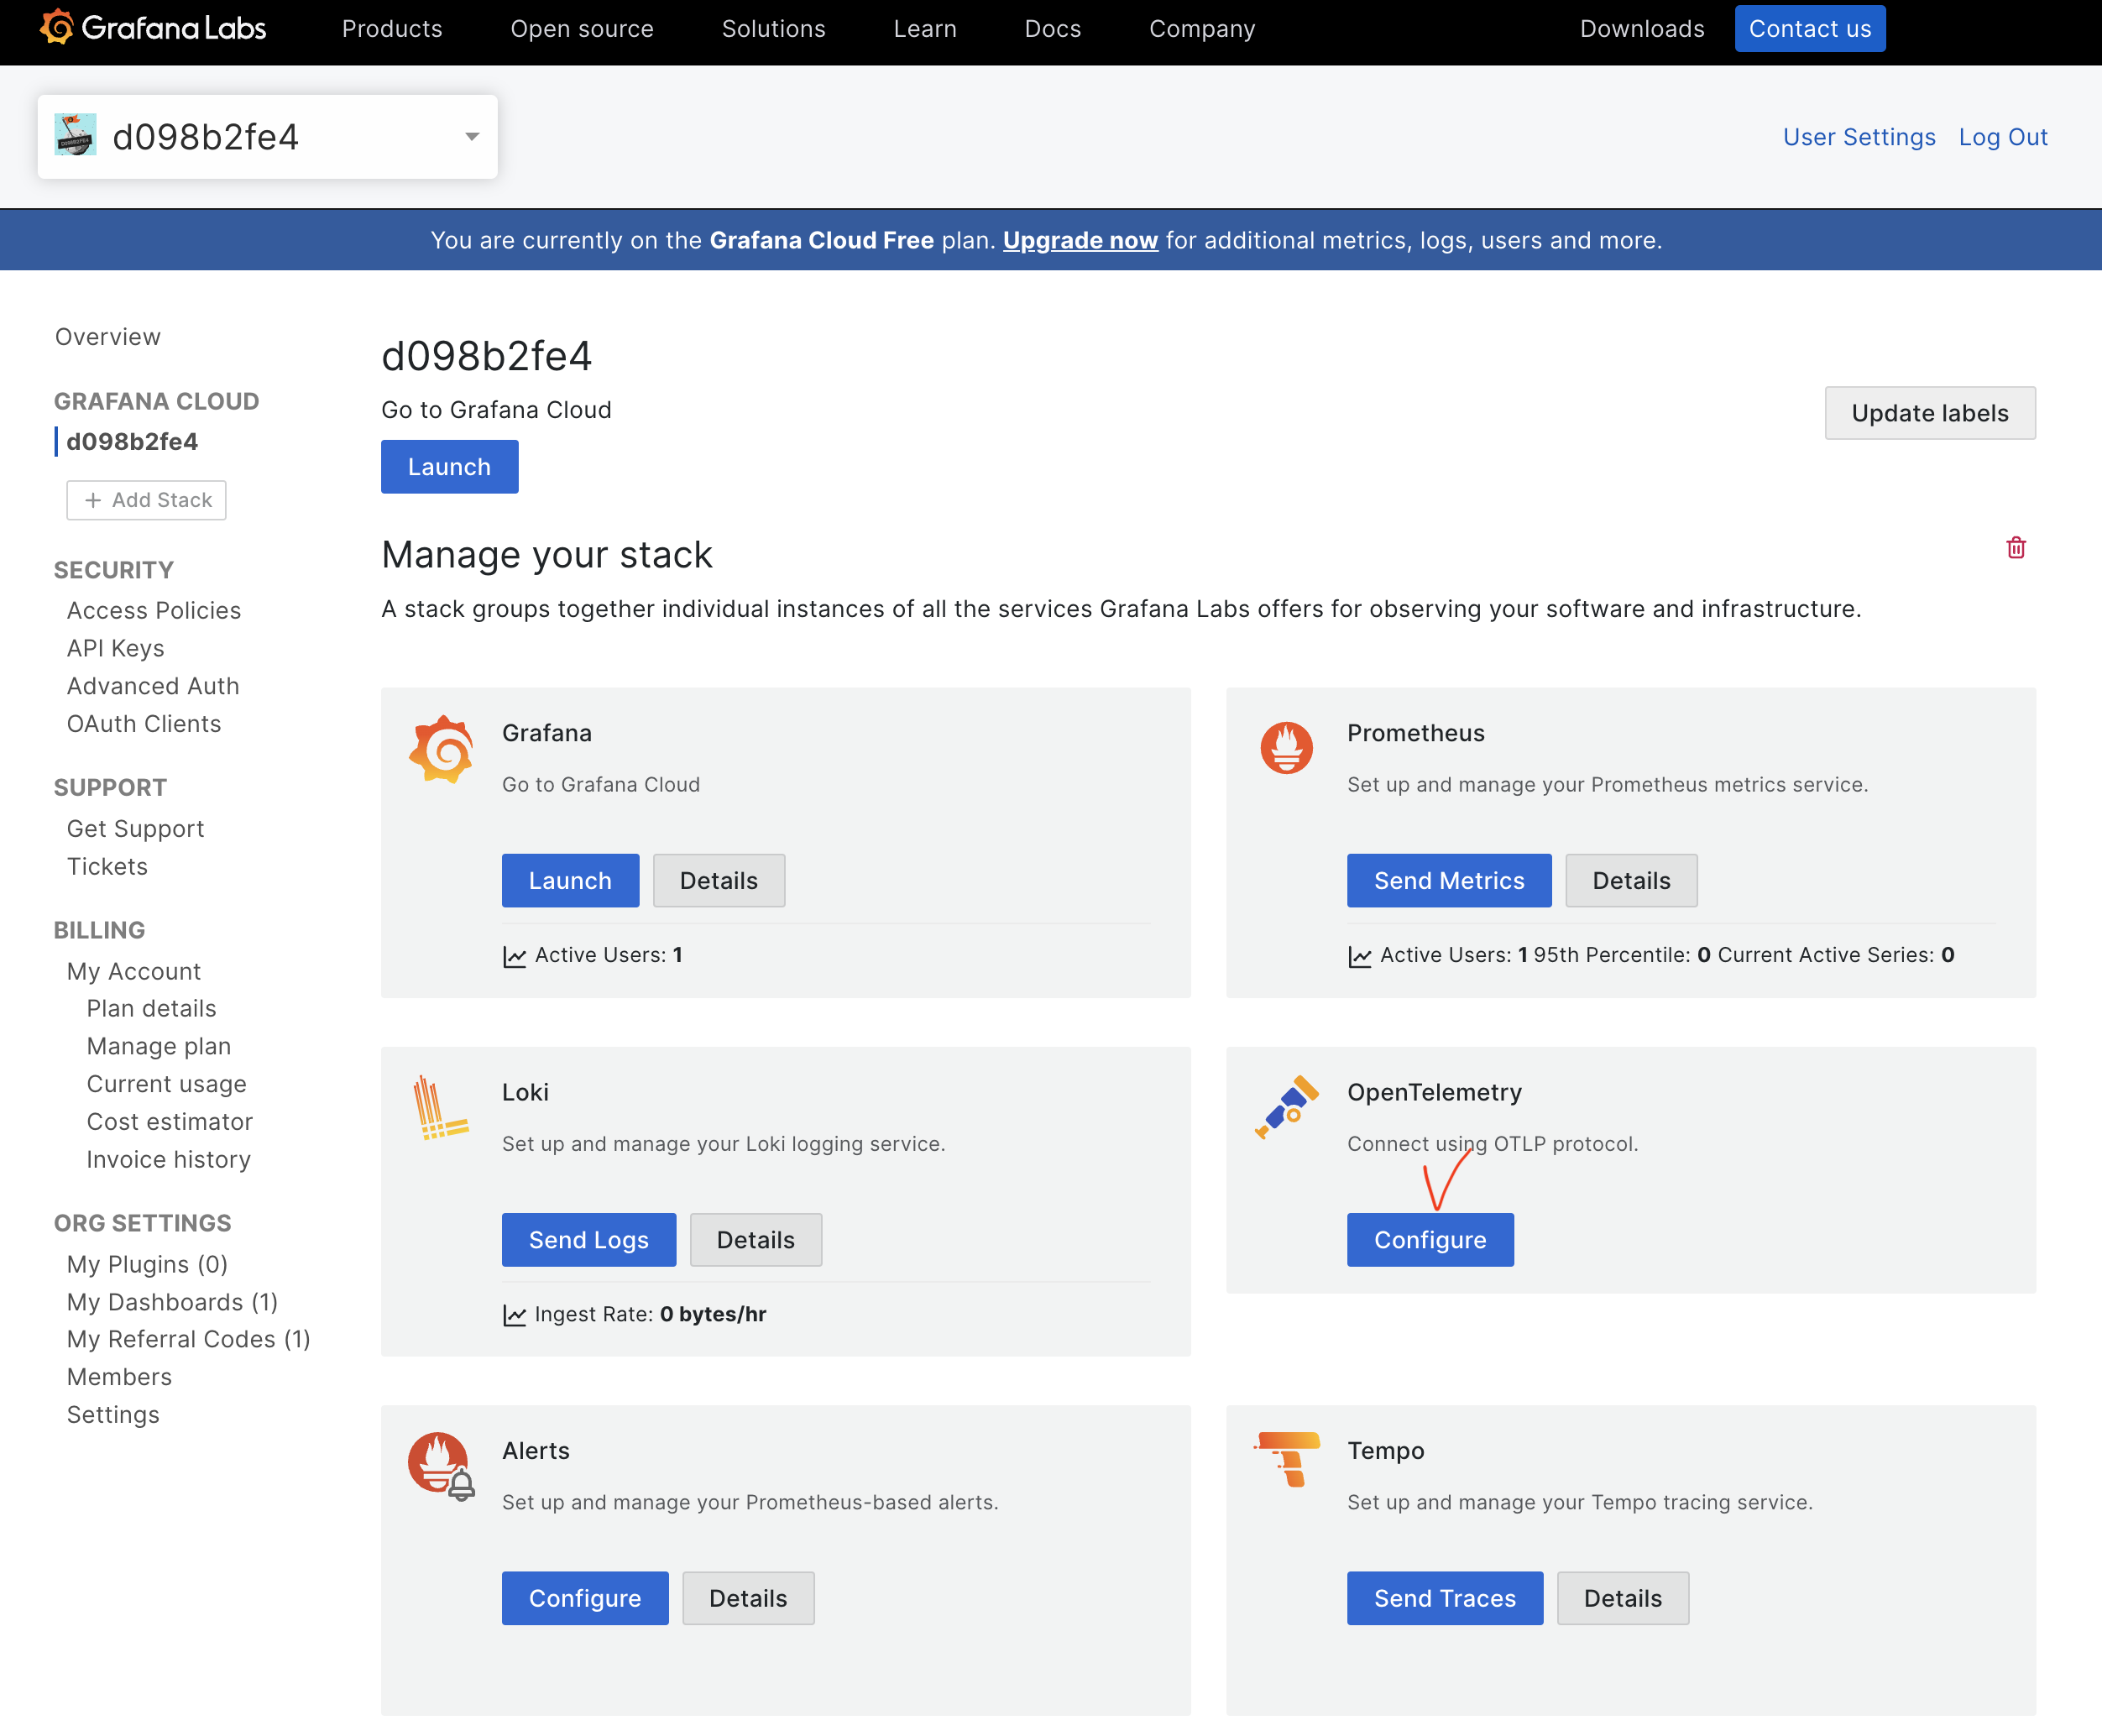
Enable OpenTelemetry OTLP collector
Create a new security token
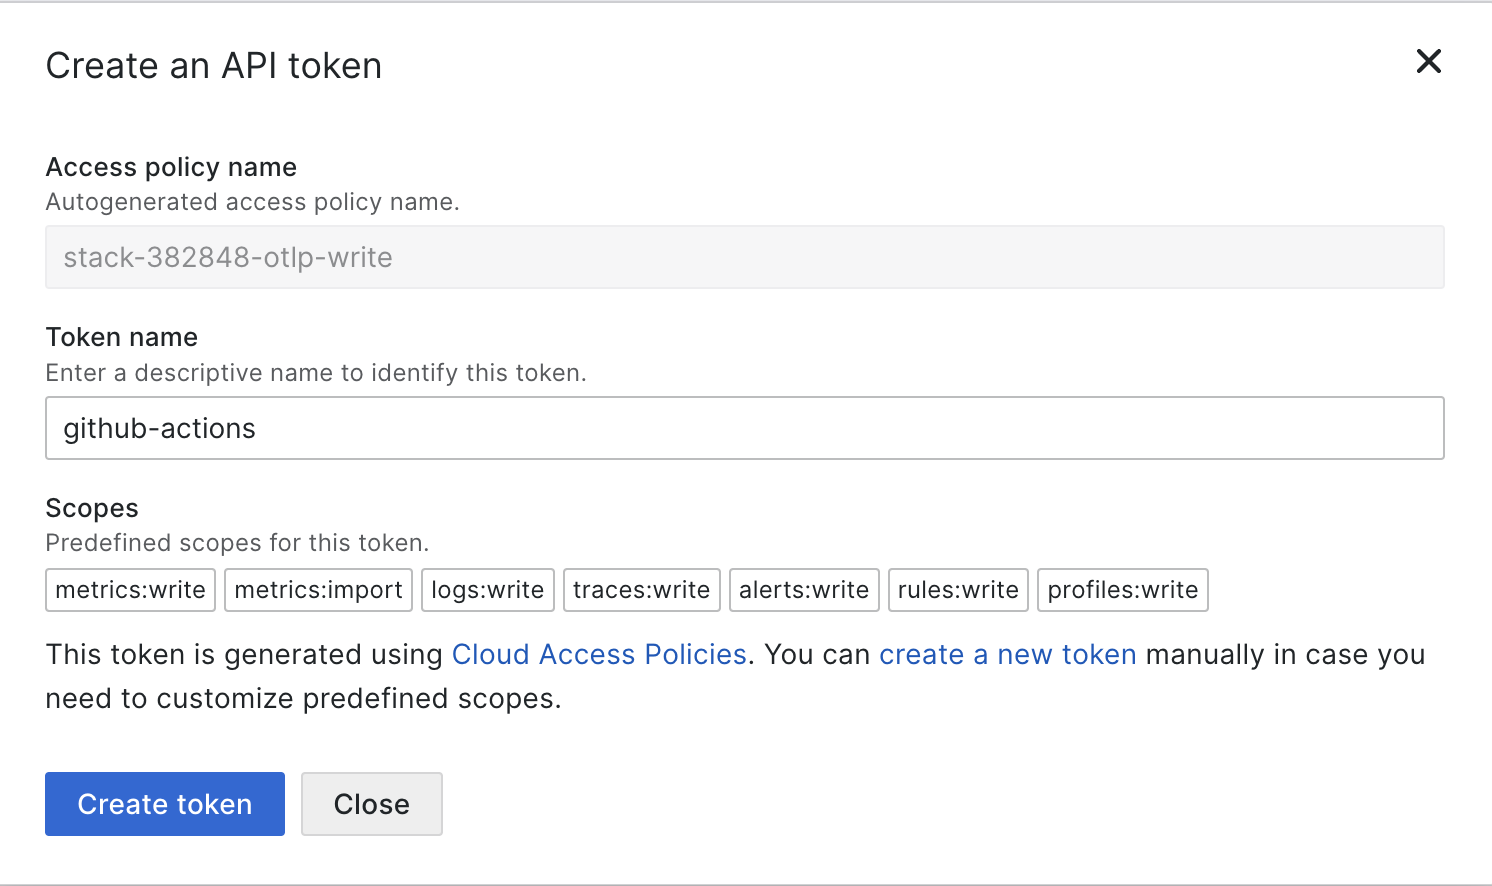
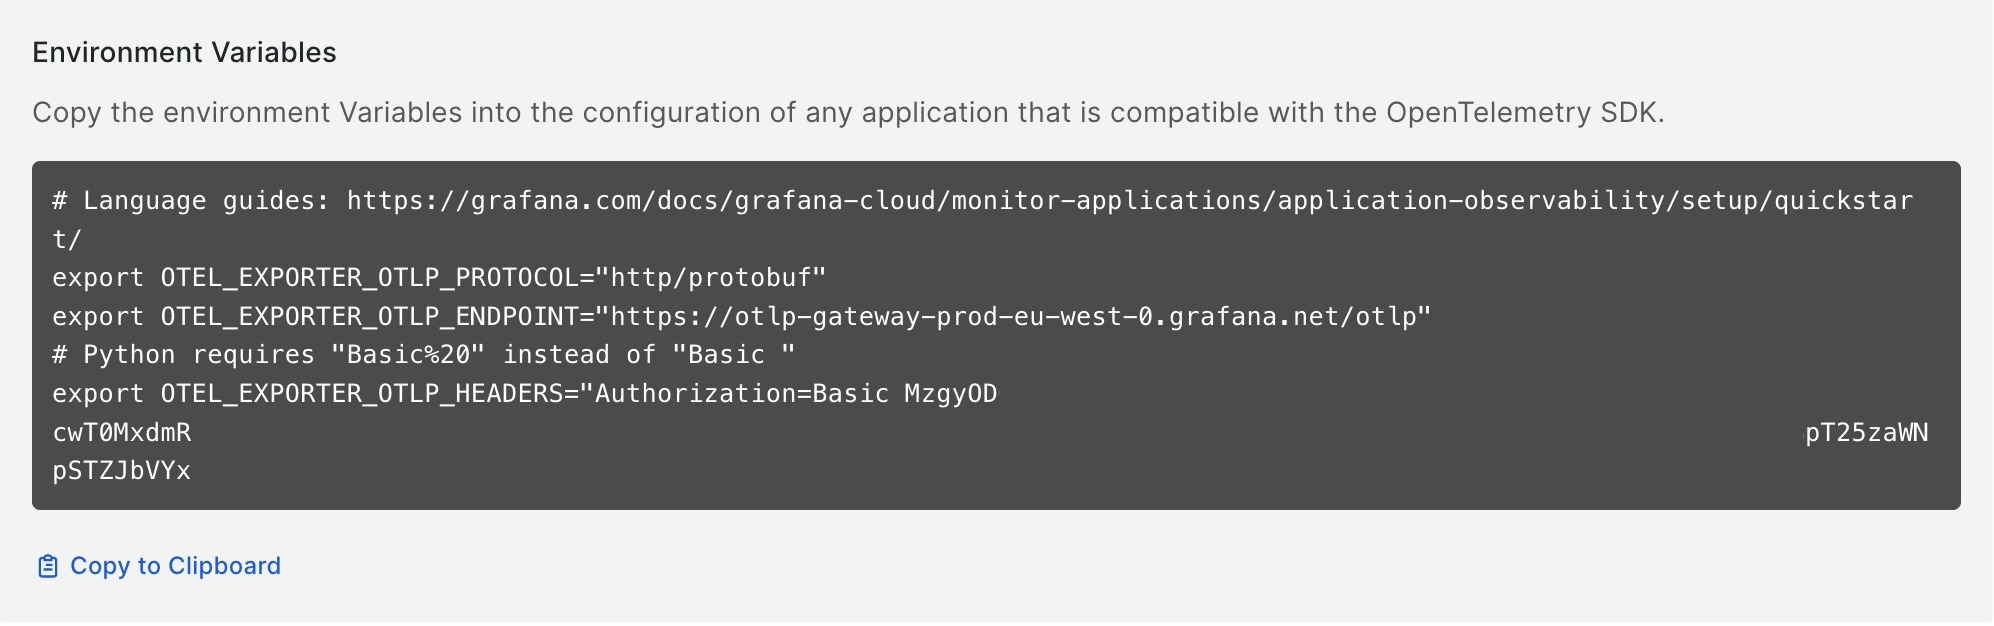
Save the secrets
Configure GitHub secrets and variables
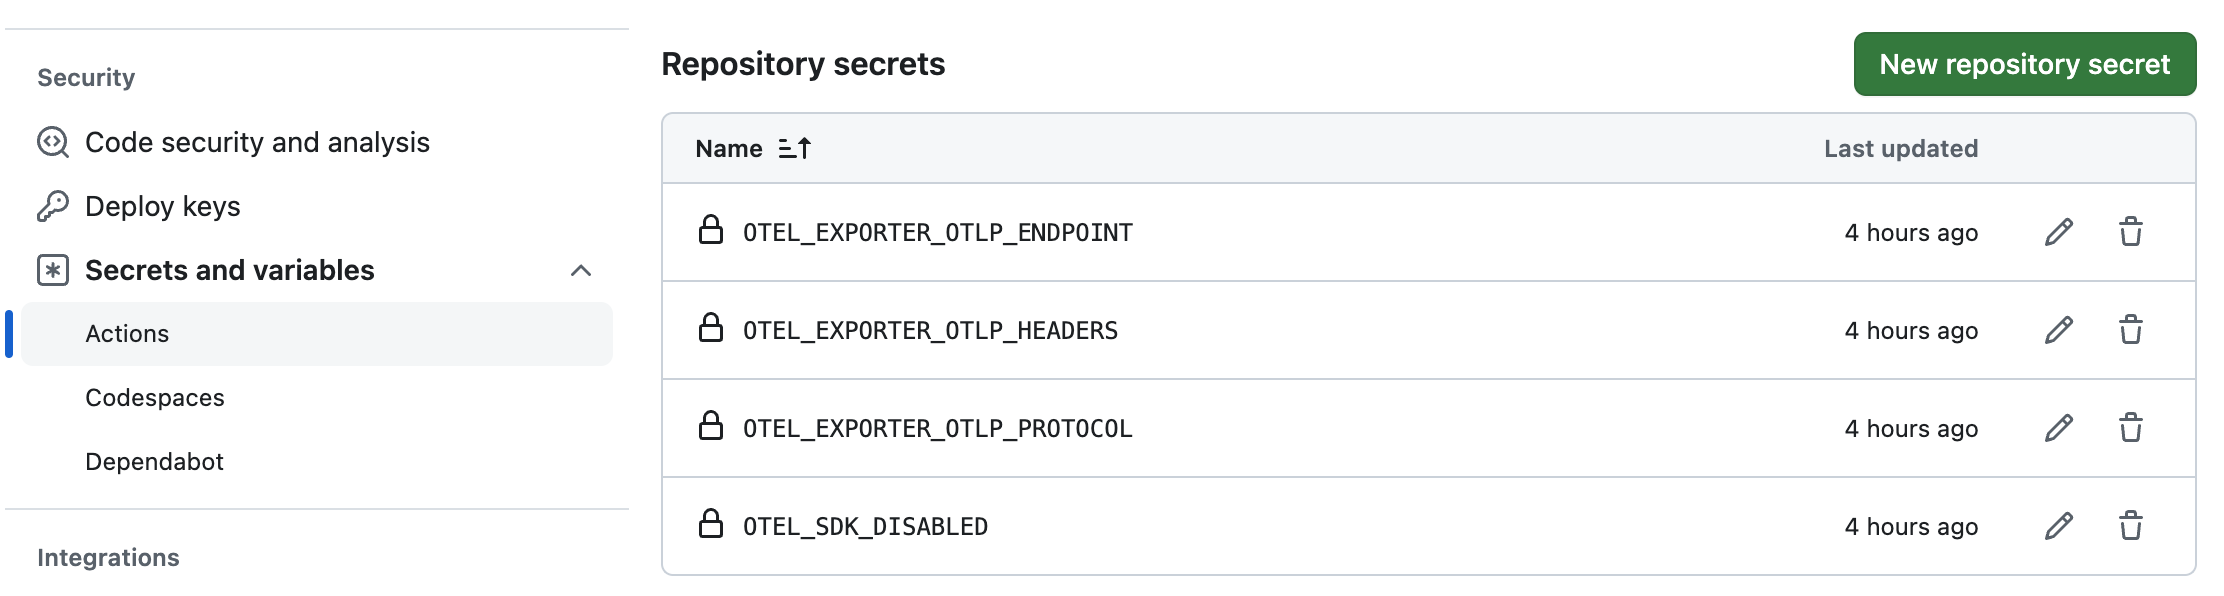
Navigate to your GitHub repository, go to Settings > Secrets and variables > Actions, and add the secrets obtained in the previous step.
The secrets will be picked up by sbt while running tests.
Configure GitHub secrets
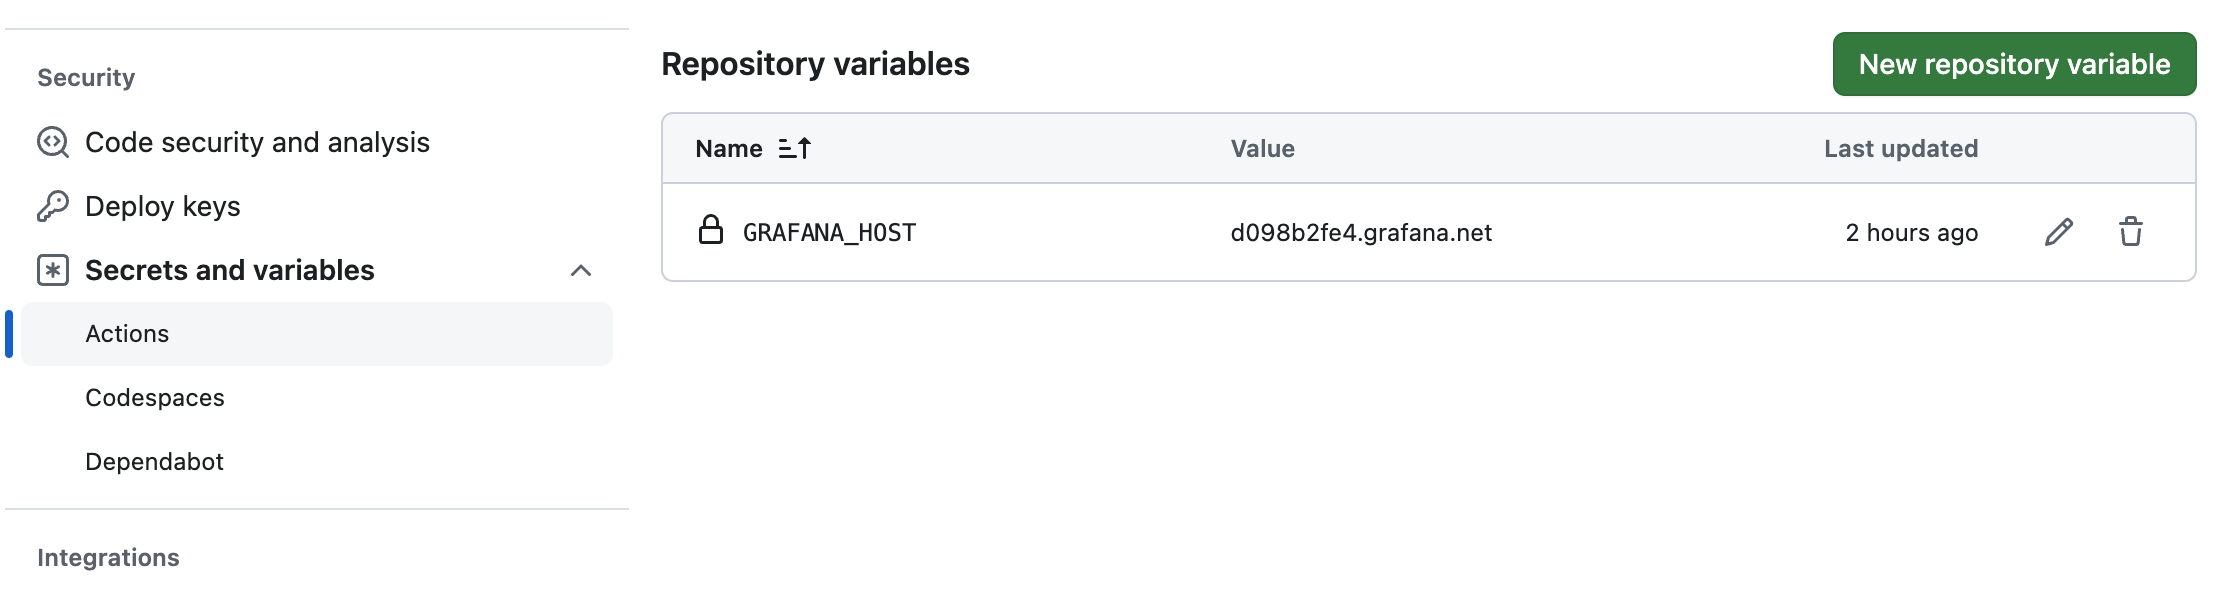
Configure GitHub variables
Bonus point. Create a comment on a PR with a link to traces
Update the build.sbt file:
ThisBuild / githubWorkflowBuildPreamble += // <1>
  WorkflowStep.ComputeVar("tests_start_time", "date -d \"$(date +'%Y-%m-%d') 00:00:00\" +%s%3N")

ThisBuild / githubWorkflowBuildPostamble += // <2>
  WorkflowStep.ComputeVar("tests_end_time", "date -d \"$(date +'%Y-%m-%d') 23:59:59\" +%s%3N")

ThisBuild / githubWorkflowBuildPostamble += { // <3>
  def body = {
    val panes =
      """{"7uq": {
        |  "datasource":"grafanacloud-traces",
        |  "queries":[
        |    {
        |      "refId":"A",
        |      "datasource":{"type":"tempo","uid":"grafanacloud-traces"},
        |      "queryType":"traceql",
        |      "limit":100,
        |      "query":"{resource.revision=\"${{ github.sha }}\"}"
        |    }
        |  ],
        |  "range":{"from":"${{ env.tests_start_time }}","to":"${{ env.tests_end_time }}"}
        |}}""".stripMargin.replace(" ", "").replace("\n", "")

    val link = s"https://$${{ vars.GRAFANA_HOST }}/explore?panes=$panes&schemaVersion=1&orgId=1"
    s"The traces can be reviewed here - $link."
  }

  WorkflowStep.Use(
    UseRef.Public("peter-evans", "create-or-update-comment", "v4"),
    name = Some("Publish 'Grafana traces' comment"),
    cond = Some("startsWith(github.ref, 'refs/pull')"),
    params = Map(
      "issue-number" -> "${{ github.event.pull_request.number }}",
      "body"         -> body
    )
  )
}- Register
tests_start_timebefore tests start - start of the day - Register
tests_end_timeonce tests are executed - end of the day - Add a comment to the pull request
It creates a comment on your pull request with a link to Grafana, where you can view traces for the specific commit and time range. Note that Grafana currently does not support timezone parameters in the URL, so the time range is set to a whole day of the test execution time.
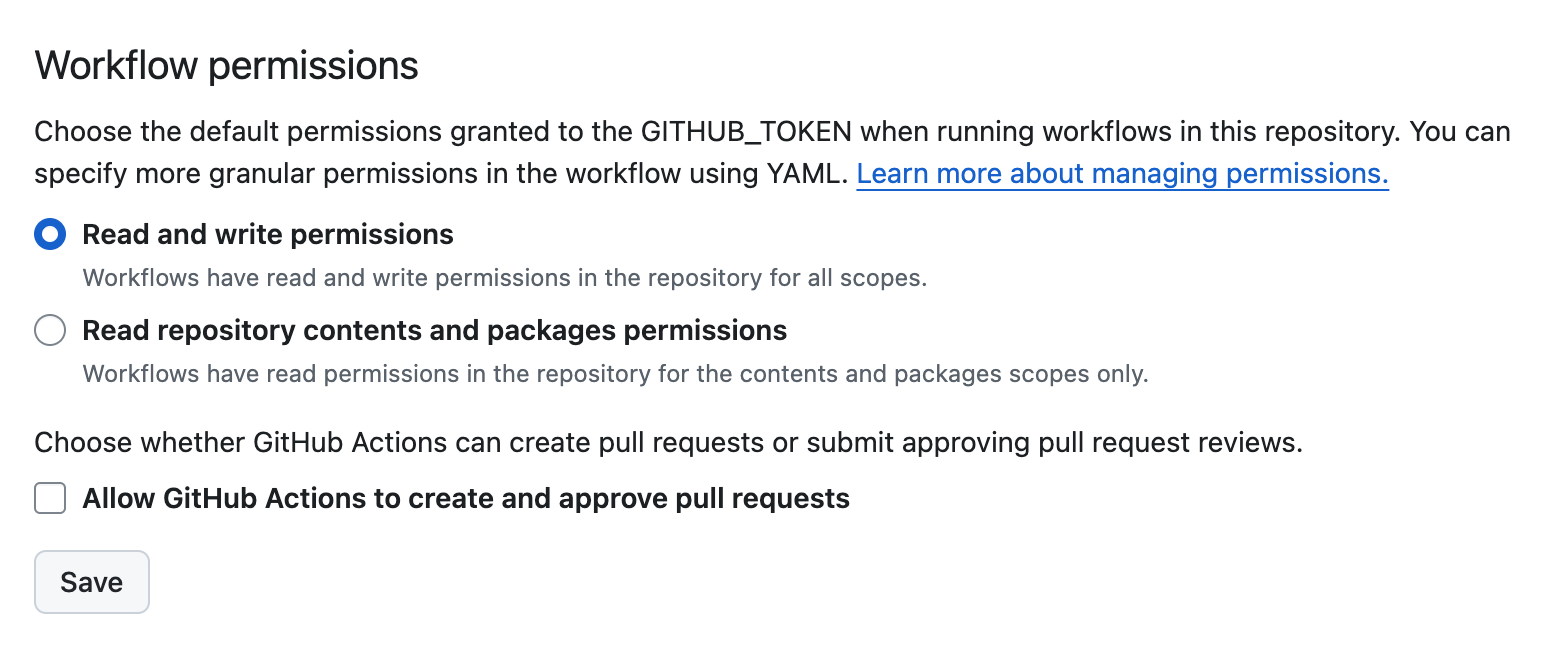
To make comments work, you must enable token's write permissions in the Settings > Actions > General > Read and write permissions:
5. Check the result
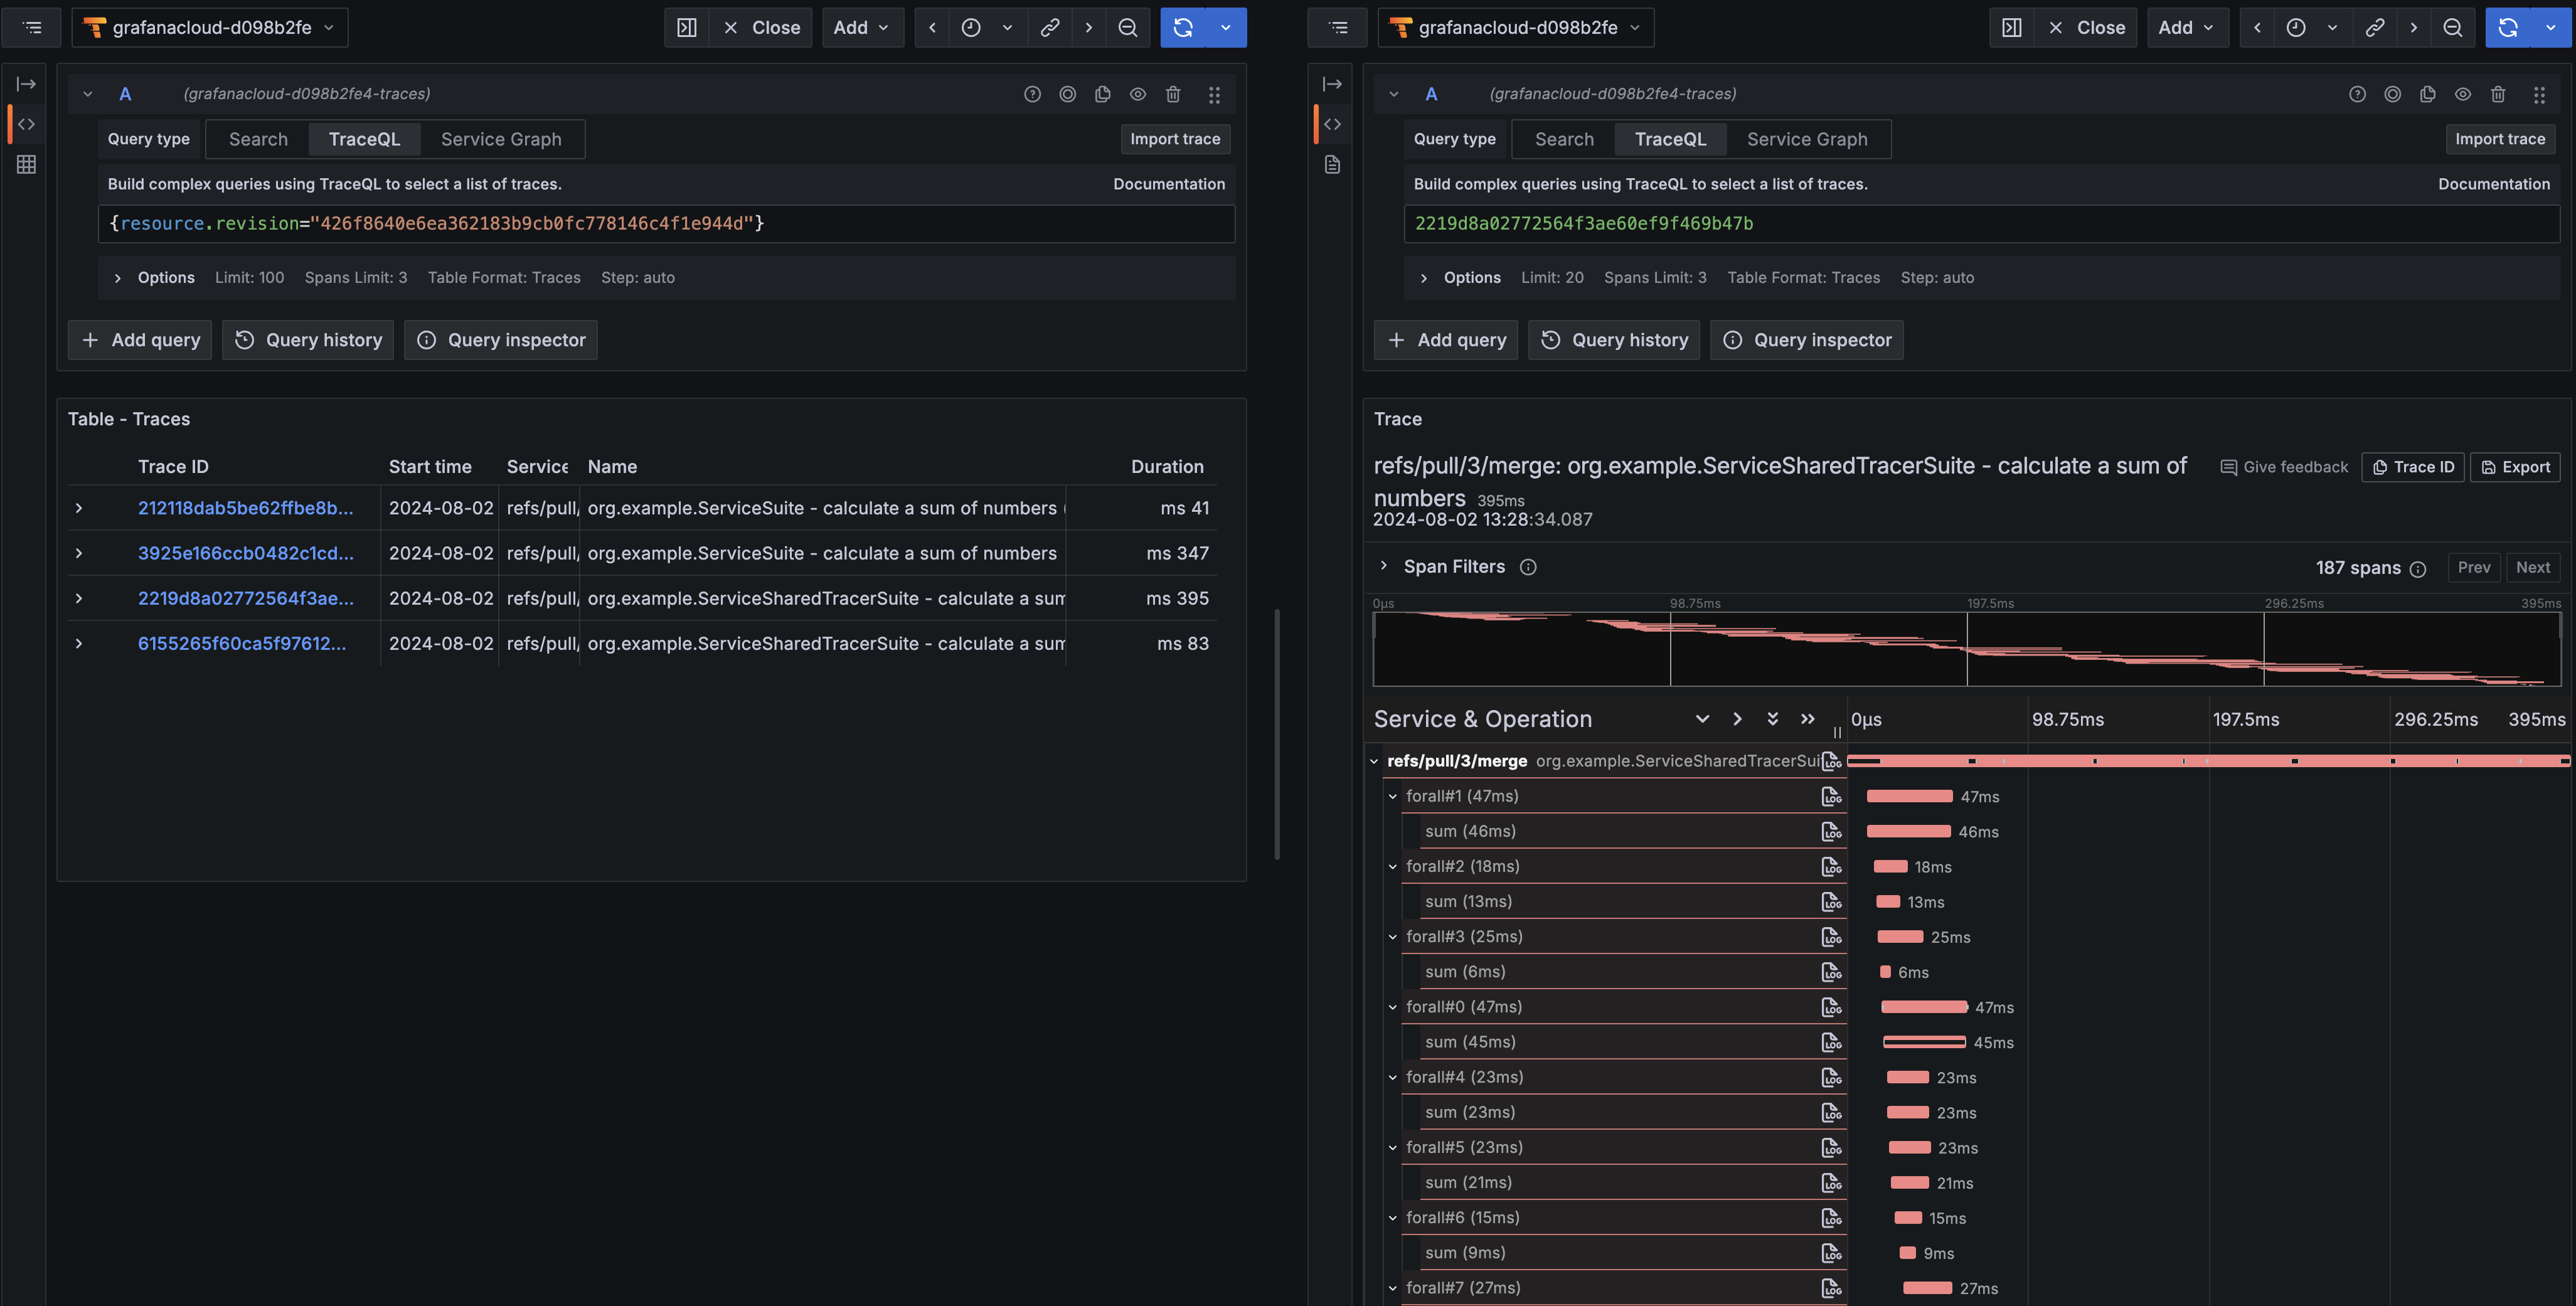
Push your changes, create a PR, check the result. The generated link automatically shows all spans associated with the current pipeline run.
Successful traces:
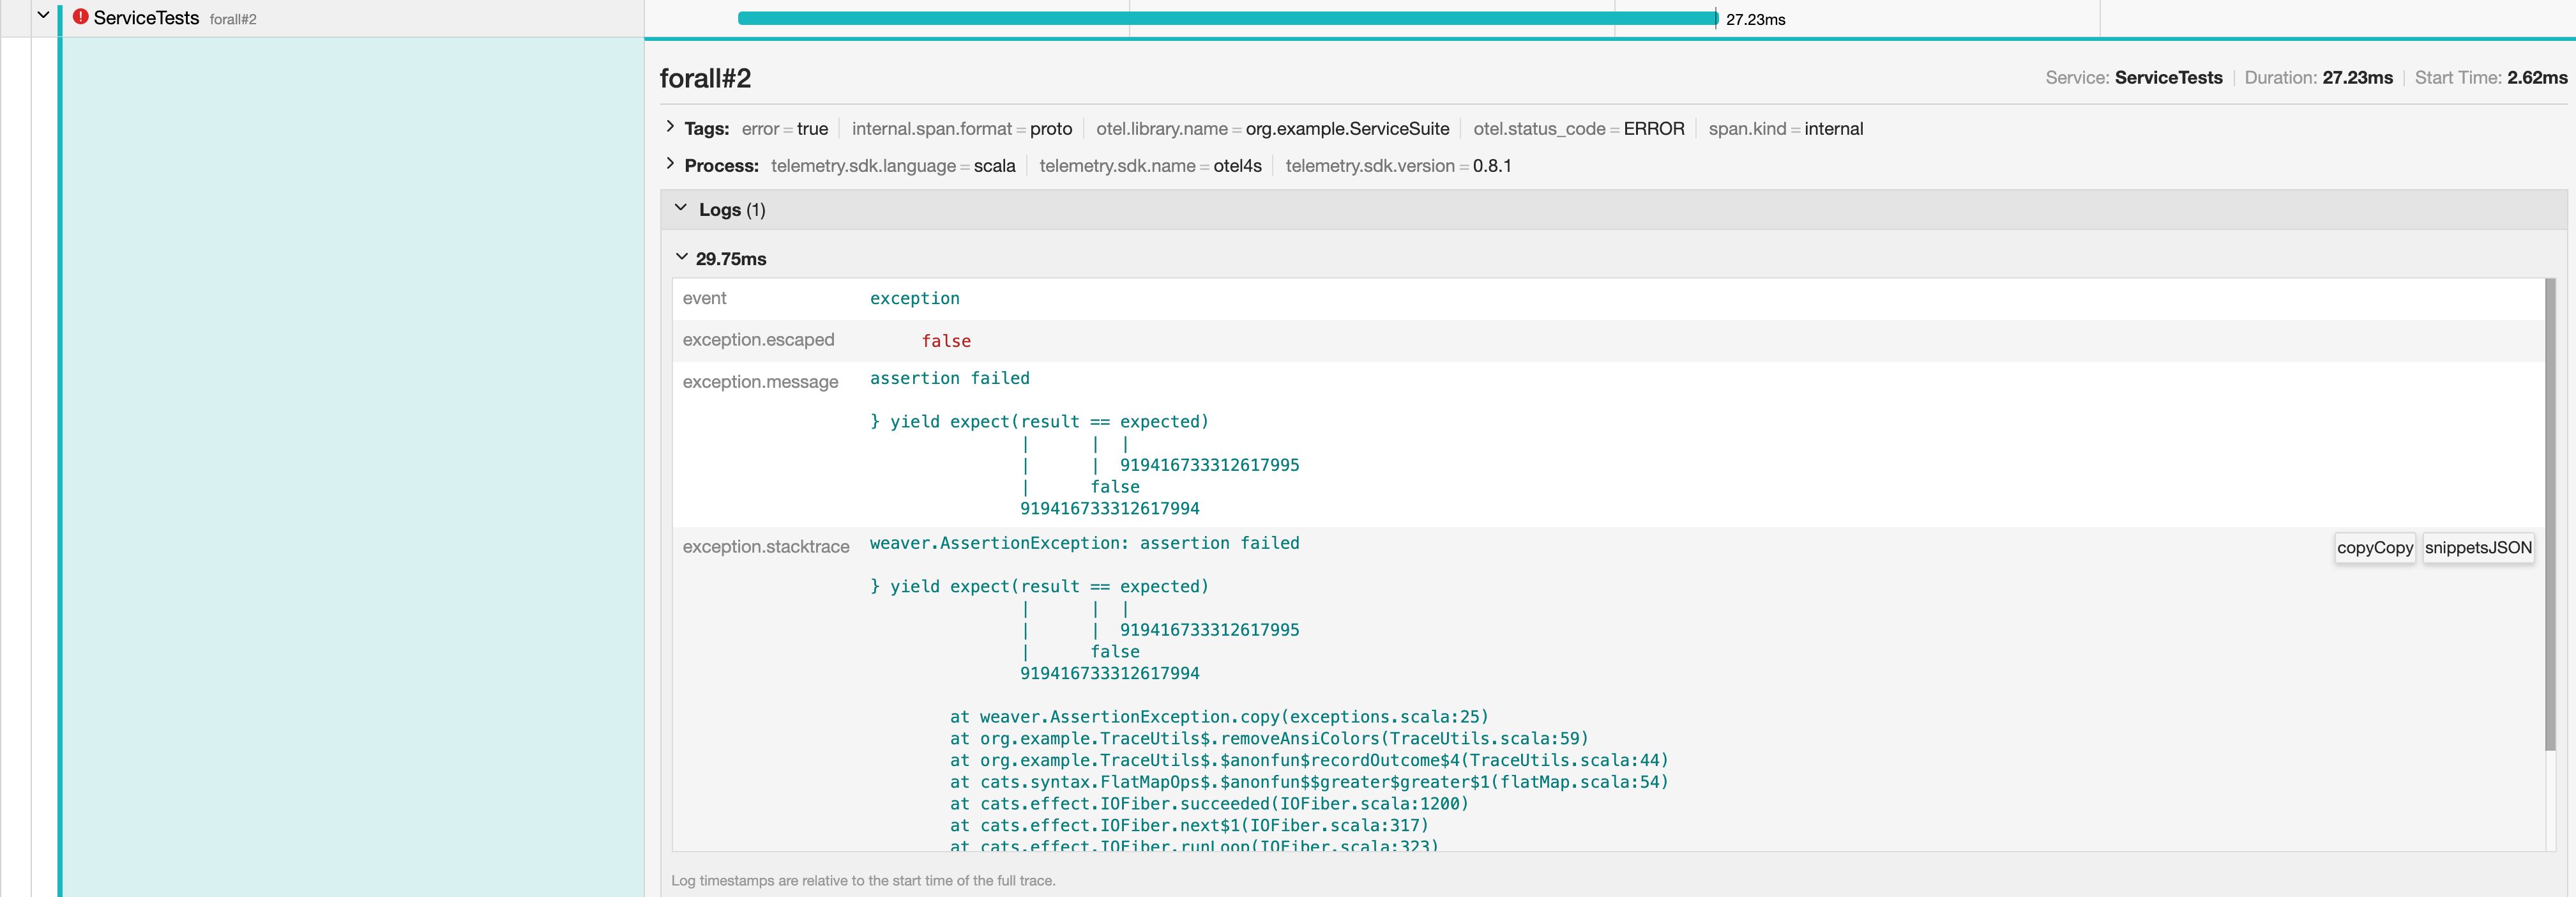
An errored trace: